
For the past four years, we’ve been inspired by the creativity of our customer agencies who tell a myriad of compelling stories with Jane, Remix’s travel time isochrone that visualizes access and mobility across a transit network. One of our favorite expressions of Jane is from Stephen Hunt with Valley Region Transit in Boise, Idaho, who relied on Jane to help his agency “celebrate the notion of freedom”. He wrote, “using Jane to estimate the accessibility for different demographics, such as low-income, minority, youth or seniors, has allowed me to [market transit as freedom] to diverse audiences, and gain broad-based support for potential service changes.” Another cherished Jane memory comes from 2017, when long range planners in King County Metro (Seattle, Washington) used Jane to showcase how access changes at various transit funding scenarios. The intuitive visualizations of Jane helped the agency build consensus for their long range plan in just under 9 months, about half the time that they had anticipated.

We are thrilled to announce a big update on how Jane navigates the physical environment: you can now customize Jane to use the pedestrian network, which provides a better representation of how people actually travel than the “as the crow flies” model.
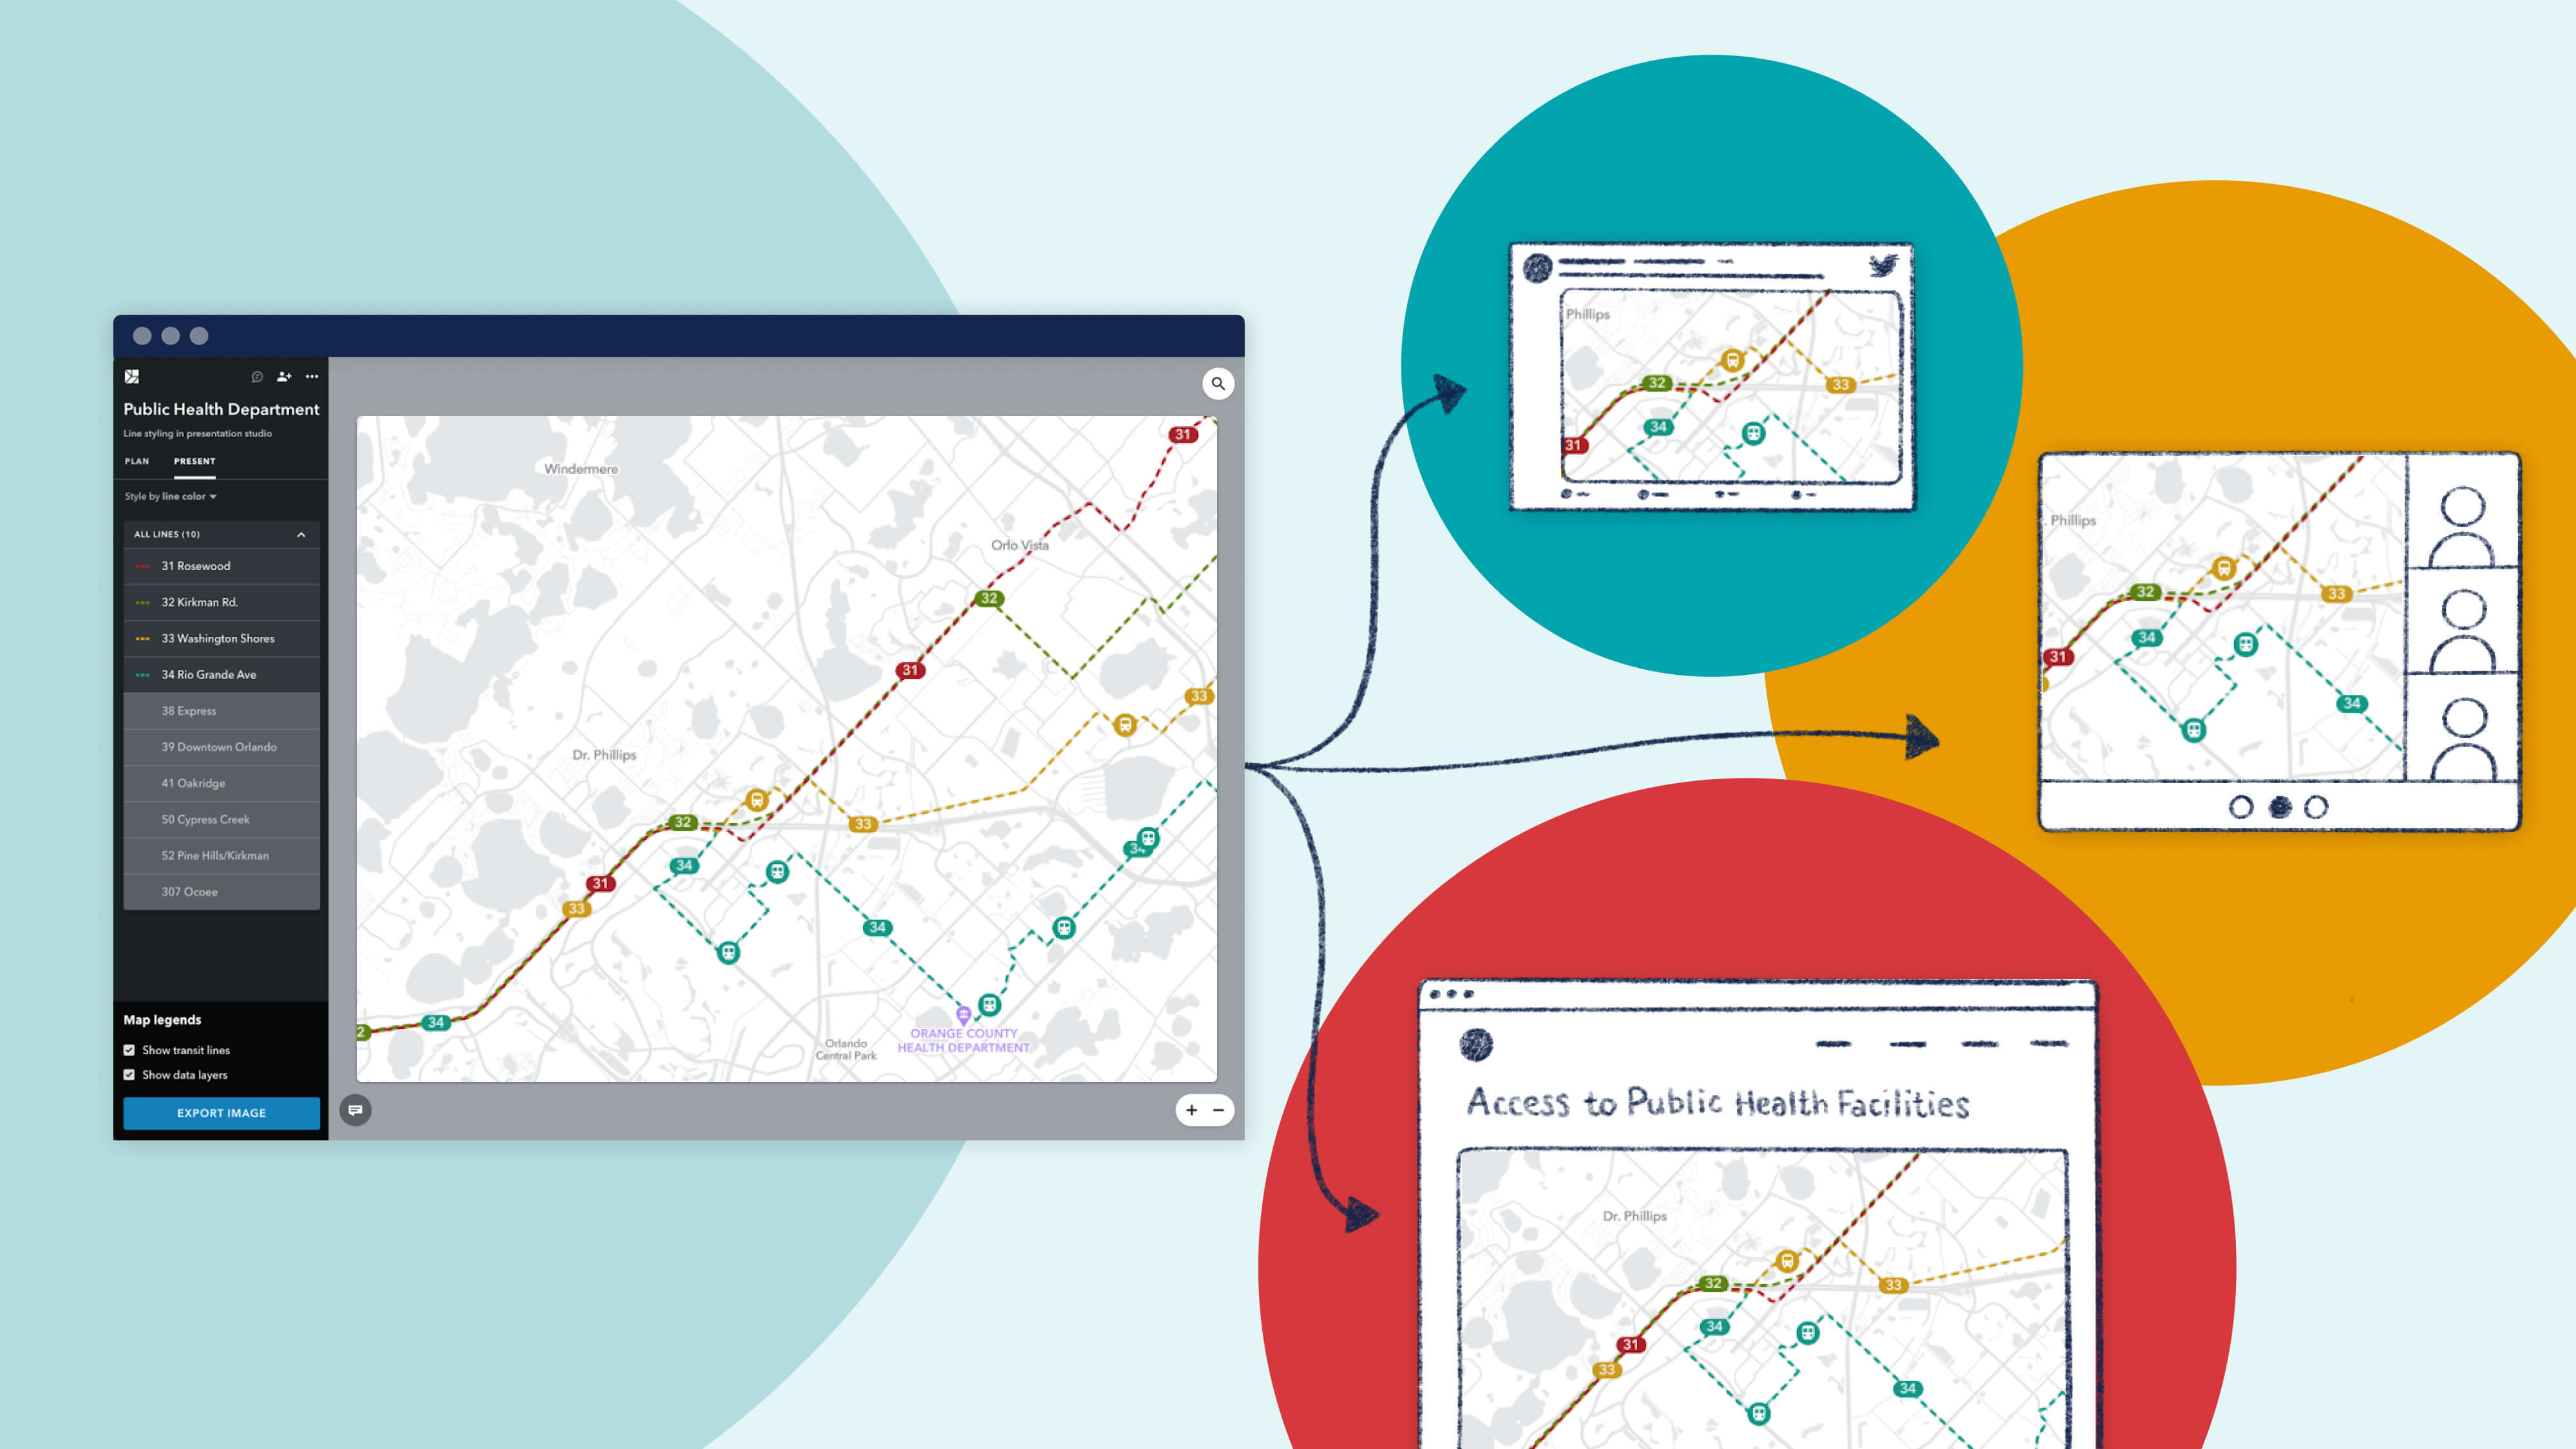
.png)
Jane 3.0 allows Remix users tackle questions such as, “What does Jane’s accessibility look like when taking into account the geographic limitations of highways, bridges and bodies of water?” Additionally, users are able to create more realistic visuals to share with their stakeholders to keep the conversation focused on accessibility and tradeoffs of service changes.
Jane 3.0 is more persuasive. The increased accuracy of Jane 3.0 helps planners build trust and consensus with stakeholders by providing the confidence that the analysis is realistic since it takes the community’s walking network into account.
“Professionally I’ve always liked to see the actual street network instead of generic travel sheds with concentric circles,” says Duane Wakan, a senior planner with Pierce Transit in Tacoma, Washington. Using the new version of Jane, Duane said “I was able to convince my agency’s internal stakeholders so that we could move ahead with proposed changes with the BRT plan.” Duane is excited to move forward with external stakeholder engagement now that he has achieved alignment within the agency. “We now feel comfortable bringing these changes to the public.”

In 2019, we increased the scope of Jane’s analysis with editable time bands, customizable wait times, demographic calculations to show access to jobs and other key services, and “Reverse Jane”, to help users understand access of a specific destination so that Jane can answer questions like, “How long does it take students across the region to get to the local community college?” or “How many people can get to the shopping district within 30 minutes?”
All this functionality is still a part of Jane, but now with enhanced accuracy.

We’d be happy to demonstrate Jane in your city with your transit network. Reach out to our team at remix.com/demo and we’ll set you up.

Introducing On-demand Planning: The first planning product for on-demand and flexible fleets that is data-driven, integrated with the fixed-route network, and collaborative.

Meet New Remix, designed to be more intuitive, flexible, and more powerfully multimodal.
Since launching Presentation Studio, we’ve been delighted to see the creative ways in which our partner agencies are using the feature. We're proud to showcase their work with a "Map Gallery."

