
Passenger load is an important performance indicator for a transit system because it provides information on how full or empty vehicles are. If passenger load for a particular bus is over capacity, a planner might make the decision to reallocate more resources to increase the frequency of that bus’s route. Ultimately, passenger load informs what the demand for transit is so that agencies can provide supply smartly.
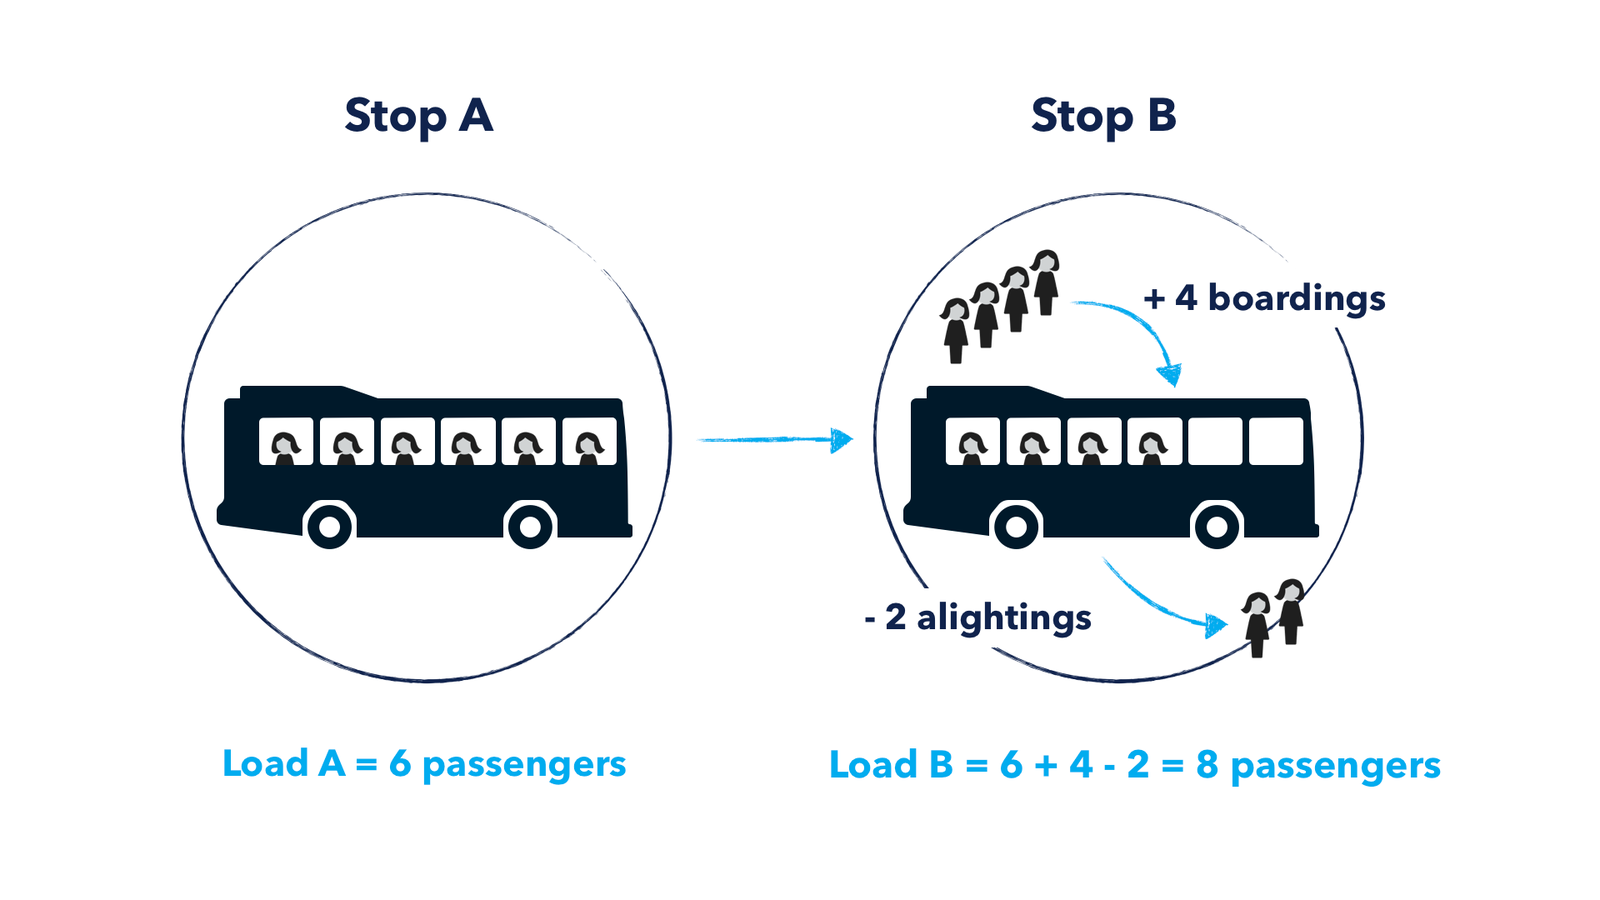
The biggest challenge with passenger load is that most agencies do not have the underlying data to calculate it. Most agencies have access to boarding data, which they collect when passengers board the bus and “tap on”. However, boarding data only shows half the story, and because “tapping-off” systems are less common, agencies are usually missing the alighting data that shows where passengers are getting off the bus.
.png)
At Remix, we’re always thinking through innovative solutions to help our customers fill their gaps. We know that alighting data is extremely valuable to agencies for estimating load, but this data is often unavailable in systems that don’t support “tapping off”. We decided to run a pilot with sample data from one of our customer agencies and create a predictive model to estimate missing alighting data.
We approached this question through predictive modeling where we:
.png)
We created several predictive models for our target variable, alightings, and compared the performance of these models to the real alighting numbers in the test dataset.
The best performing model had the following metrics:
In other words:
These are pretty good results considering that we had stops with more than 400 alightings!
.png)
Missing by an average of twenty alightings might seem high, but remember that averages are influenced by extreme values. The graph above, shows that there are a few points that fall very far from the line. These are outliers and they are responsible for considerably increasing the mean error of the estimates. Out treatment of outliers might change in future predictive models as we introduce more data.
In order to investigate further on the accuracy of our model, we took a look at the R squared per route.
.png)
We can see that performance across individual bus routes vary significantly. From this analysis, we discovered that routes with more information have a bigger influence in the model’s creation and therefore overfit the model to the best performing lines. The routes that show a performance of 70% or higher are responsible for 83% of the boardings. This is a good discovery for future modeling. Perhaps this model should only be used for routes with a minimum number of boarding and alighting data.
Don’t worry, this is where things get really interesting. When we built the predictive model, we needed to first test its accuracy before incorporating another layer to the experiment. Now that we know the predictive model can yield a performance of nearly 80%, we felt optimistic enough to think through another methodology for when alighting data is completely missing.
Here’s a hypothetical situation to illustrate our thinking:
We can create a model from the data of the first three cities and use said model on the fourth city to get an estimate on alightings.
.png)
The meaty part here is being able to find similarities across cities by describing them “abstractly.” For instance, mathematical models don’t care if the city’s name is Chicago or San Francisco. In order to find similarities, we flatten a city’s character into variables like boardings, jobs, population, number of trips, etc. In doing so, we can make cities comparable. The image below demonstrates visual abstractions (in this case, a transit network without stops) can help us identify similarities.
.png)
We are excited about this added layer in predictive modeling and hope to see a future in which predictive modeling fills in data gaps for passenger load and visualize this data in Remix. Once passenger load (the “demand” for transit) is in Remix, planners can use our platform to design the “supply” of transit.
.png)
But before we invest more in this experiment, we want to hear from you:
If you want to share your thoughts or learn more about our experiment, please reach out to us here or schedule a call with your customer success manager. Thanks for sharing!

Here's how Remix celebrated Black History Month this past February with art, literature, food, and community events that focused on the theme of Black Resilience.

Working at Remix is a constant reminder that no matter who you are or what your story is, space can always be made and differences can bring people together.

Get a glimpse into how Remix celebrated National Native American Heritage Month.

